Air pollution stands out as the most disturbing aspect of environmental damage and health risks. As per the World Health Organisation (WHO), 13 Indian cities are among the World’s top 20 cities with severe levels of PM2.5 and PM10, writes AK Jain, former Commissioner (Planning), Delhi Development Authority (DDA).
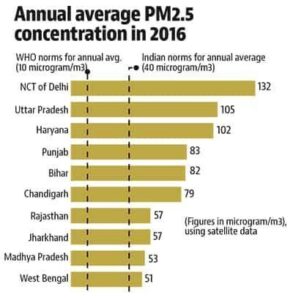
Fig. 1: Annual Average PM2.5 Concentration (2016) Sources: WHO, Safar, CPCB

According to the Environment Pollution Control Authority (EPCA), the severity of air pollution is categorised as moderate, poor, very poor, severe, severe plus or emergency, which is based on the levels of PM2.5 and PM10 in the air.
Table 1: Severity Measure of Air Quality
| Moderate | When PM2.5 is between 60-90 µg/m3 or PM10 is between 10-250 µg/m3 |
| Poor | When PM2.5 is between 91-120 µg/m3 or PM 10 is between 251-350 µg/m3 |
| Very Poor | When PM2.5 is between 121-250 µg/m3 or PM 10 is between 351-430 µg/m3 |
| Severe | When PM2.5 level is above 250 or PM10 is level above 430 µg/m3 |
| Severe+ or Emergency | When PM2.5 levels cross 300 µg/m3 or PM10 levels cross 500 µg/m3 (five times above the standard and persist for 48 hours or more) |
Source: EPCA
The Supreme Court of India order dated 16 December 2021 directed the Commission for Air Quality Management in the NCR and Adjacent Areas (CAQM) to obtain suggestions for a permanent solution for air pollution in Delhi-NCR.
Sources of Air Pollution
Air pollution is a multi-headed problem which emanates from various sources. The data needs to be documented and analysed in order to work out solutions tailored to such sources.
Table 2: Sources of Air Pollution

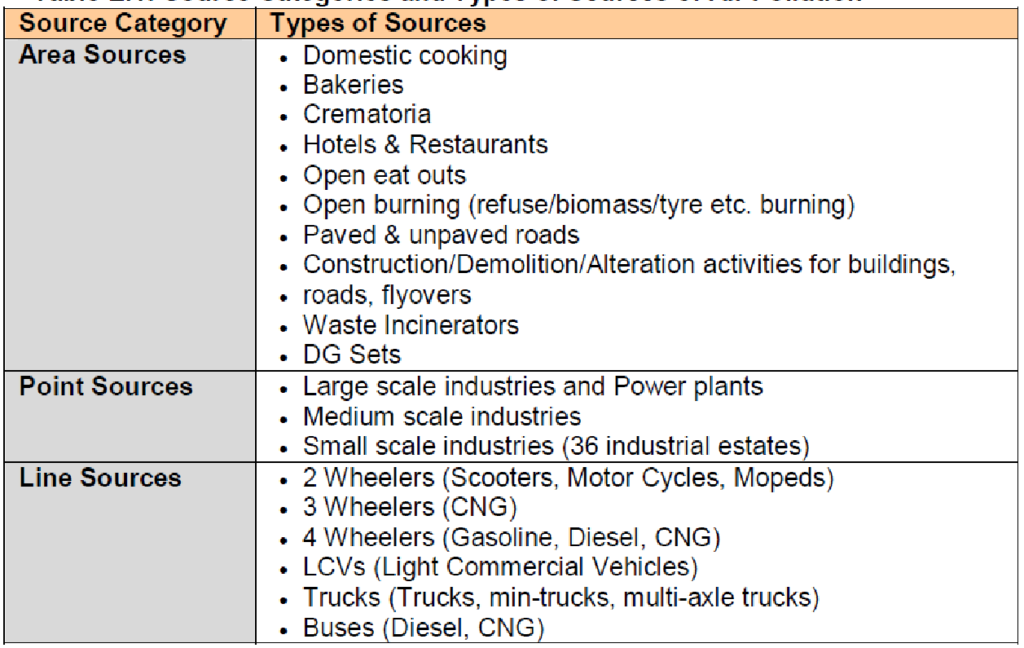
Source: CPCA, DPCA, NEERI
The major sources of air pollution are urban transport, dust from construction and demolition activity, the use of ‘dirty’ fuels such as diesel, use of coal for industries and electricity generation, use of wood and coal for cooking, industrial pollution, ozone-depleting air-conditioners and burning of agricultural and urban waste. While primary particles like SO2 and NO2 are directly released into the atmosphere from sources, such as industries and vehicles and secondary particles, such as sulphates, nitrates and organic aerosols are formed from these primary particles through reaction by solar radiation, relative humidity and presence of metals.
A consequence of rapid motorisation in India, in large cities like Delhi, is visible air pollution. Its impact on the natural and the built environment (noise, pollution, traffic accidents, community severance) are discernible all over. The fast growth of private vehicles is seen as a most intractable source of carbon emissions. Environmental footprints of urban transport include the number of resources (including embedded energy) used in their production, the amount of waste produced by their disposal and the continued use of fossil fuels. In Delhi, 72 per cent of emissions (suspended particulate matter) are from motorised vehicles. Of these, the private vehicles, which are 90 per cent of total motorised transport and carry 31 per cent of the vehicular trips are responsible for 90 per cent of emissions. Violent traffic and transport impact the health and safety of the people. With less than 1 per cent of the world’s vehicle population, India accounts for 6 per cent of the world’s road accidents and 10 per cent of the world’s road fatalities. Over 1.41 lakh people die in road accidents and over 1 million fatal road accidents happen every year.
Studies show that road transportation needs four to five times the energy that is needed by a train. The energy used by a car to carry a passenger over one kilometre is three to four times that of a bus. Greenhouse gas emission per passenger of public transport (bus, rail, and trams) is about 1/12th of that of a car. Although non-motorised transport (NMT), including walking, is ideal from the point of view of emissions in terms of kilometres travelled, these cover only 1 to 2 per cent of the total kilometres travelled, even if the proportion of trips is as high as 40 per cent. It implies that rail-based public transport, bus, cycle, and walking provide greener transportation, which helps in the reduction of fossil fuels and air pollution. A compact and smart city with mixed land use, cleaner, fast and low energy public transport provides sustainable mobility. In terms of capacity, costs and emissions, walking is the most competitive, economical and environmentally sustainable mode of mobility.
Table 3: Environmental Sustainability of Different Modes of Transport
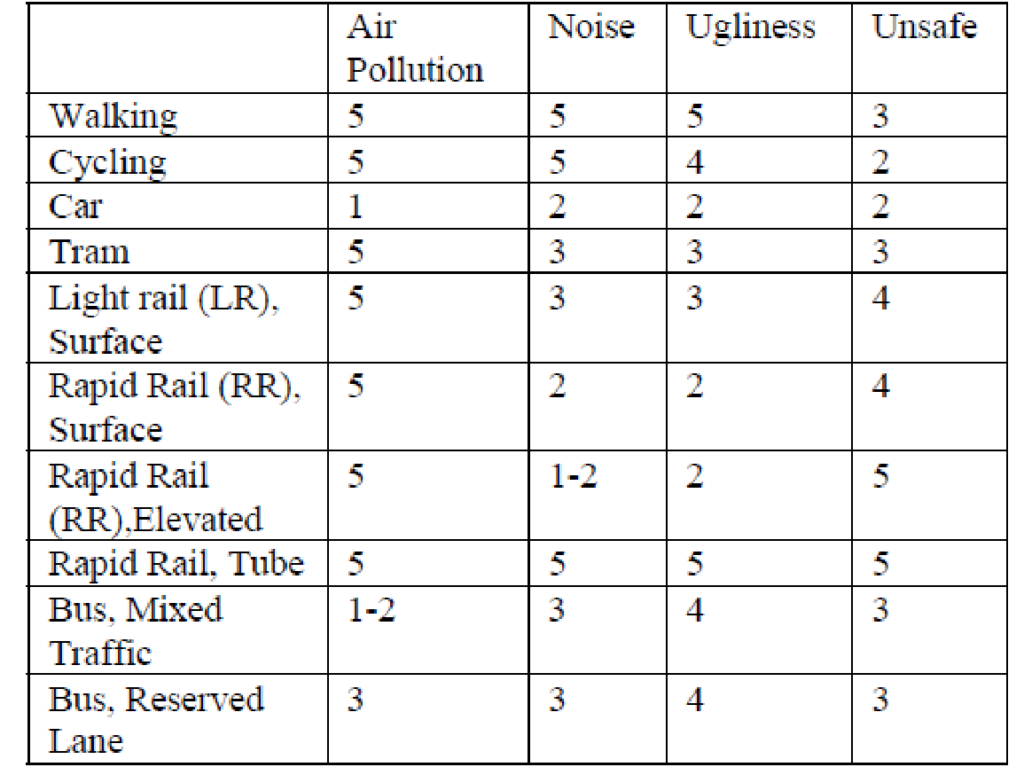 Legend: 1 = very bad, 2 = bad, 3 = average, 4 = good, 5 = very good
Source: Vuchie, R.V (1981), “Urban Public Transportation Systems and Technology”, Prentice Hall, Englewood Cliffs, New Jersey, cited by Raman Parti and Surjit S Katoch, Efficient Transportation Planning and System Integration for Healthy Environment of Large Cities, Proceedings of International Conference on Energy and Environment March 19-21, 2009
Regulating the air pollution from different stakeholders is difficult because its impact is geographically dispersed, often across the States and jurisdictional lines. For instance, around half of Delhi’s air pollution during the months of October and November is attributed to the burning of agricultural waste in neighbouring states. This means that apart from localised solutions to air pollution, the Government of NCT of Delhi must also coordinate with the governments of Punjab, Haryana, Uttar Pradesh and Uttarakhand to control this external source of pollution.
The central conflict in the effort to control air pollution is the balancing of effective environmental policies against robust economic growth, much of which is driven by mass consumption and unsustainable technologies. The CNG buses are costlier than the unregulated, heavily polluting private buses. Likewise, the use of ‘dirty’ fuels such as wood and coal is much more polluting than using a costlier LPG stove or induction cooker. The policymakers find it hard to curtail carbon inefficient consumption because doing so would prove unpopular with the masses. However, such a notion ignores the economic cost of rising air pollution, something that still needs extensive research to be conducted for it to be properly quantified.
Air pollution is not a standalone factor but is a product of several aspects of sustainability, such as mobility, recreation, greenery, solid waste management, energy and infrastructure services.
National Clean Air Programme (NCAP)
The Government of India have launched the National Clean Air Program (NCAP) and Graded Response Action Plan (GRAP). The incidences of episodic air pollution in India, especially in Delhi NCR, in recent years have led to the preparation of a comprehensive National Clean Air Programme (NCAP). It seeks to have efficient data management and dissemination, public outreach, and timely measures for prevention and mitigation of air pollution.
The Government is executing the National Air Quality Monitoring Programme (NAMP), which consists of 691 manual operating stations covering 303 cities/towns. Under NAMP, four air pollutants viz. Sulphur Dioxide (SO2), Oxides of Nitrogen (NO2/NOx), Suspended Particulate Matter (PM10) and Fine Particulate Matter (PM2.5) have been identified for regular monitoring at all the locations. In addition, there are 101 real-time Continuous Ambient Air Quality Monitoring Stations (CAAQMS) in 57 cities monitoring eight pollutants viz. PM10, PM2.5, SO2, NOx, ammonia (NH3), CO, ozone (O3) and benzene. The monitoring is being carried out with the help of Central Pollution Control Board (CPCB); State Pollution Control Boards (SPCB); Pollution Control Committees (PCC) and National Environmental Engineering Research Institute (NEERI), Nagpur.
National Ambient Air Quality Standards define the ambient air quality with reference to various pollutants notified by the CPCB under the Air (Prevention and Control of Pollution) Act, 1981. Major objectives of NAAQS are (i) to indicate necessary air quality levels and appropriate margins required to ensure the protection of vegetation, health and property, (ii) to provide a uniform yardstick for assessment of air quality at the national level, and (iii) to indicate the extent and need of monitoring programme.
National Air Quality Index (AQI) comprises six categories, namely Good, Satisfactory, Moderately polluted, Poor, Very Poor, and Severe. Each of these categories is decided based on ambient concentration values of air pollutants and their likely health impacts. For eight pollutants (PM10, PM2.5, NO2, SO2, CO, O3, NH3 and Pb) National Ambient Air Quality Standards have been prescribed.
CPCB has issued a comprehensive set of directions for implementation of 42 measures to mitigate air pollution comprising action which include control and mitigation measures related to vehicular emissions, re-suspension of road dust and other fugitive emissions, bio-mass/municipal solid waste burning, industrial pollution, construction and demolition activities. These were issued initially for implementation in NCR but have now been extended to other States in India.
Vehicles have been identified as major source of pollution. In this regard Bharat Stage IV (BS-IV) norms have been launched for mandatory implementation since 1st April 2017 and BS-VI since 1st April 2020. Other measures include use of cleaner/alternative fuels like CNG, LPG and ethanol blending in petrol in order to reduce vehicle exhaust emissions, promotion of public transport, Pollution Under Control Certificate, lane discipline, vehicle maintenance, etc. It is estimated that a 5 per cent of blending can save around 1.8 million barrels of crude oil.
The renewable ethanol content, which is a by-product of the sugar industry, is expected to result in a net reduction in the emission of CO2, carbon monoxide (CO), and hydrocarbons (HC). Ethanol itself burns cleaner and burns more completely than petrol it is blended into. In India, ethanol is mainly derived by sugarcane molasses, which is a by-product in the conversion of sugar cane juice to sugar.
Graded Response Action Plan (GRAP)
The Government has notified a Graded Response Action Plan for Delhi and NCR, comprising the graded measures for each source of air pollution. It also gives a health advisory for each level of AQI. The plan has been framed keeping in view the key pollution sources in Delhi and National Capital Region (NCR). While major sources of pollution-vehicles, road dust, biomass burning, construction, power plants, and industries remain continuous throughout all seasons, the episodic pollution from stubble burning, increase in biomass burning, and more depending on seasons. During winter the relative share of air pollution from the vehicles, biomass burning, municipal solid waste burning, fire-crackers, stubble burning, construction, and secondary particles increase. During summer, the influence of road dust, fly ash, vehicles, biomass burning, etc. is high. The GRAP includes appropriate measures for each level of pollution. The measures are graded from public health emergency level to downward. Emergency and Severe levels include cumulatively all other measures listed under Very Poor, Poor and Moderate AQI. The responsibility of implementing the GRAP lies with the EPCA.
Strategic Planning for Clean Air
According to the Intergovernmental Panel on Climate Change (IPCC), urban areas account for more than half of global primary energy use and energy related CO2 emissions. They account for 67 to 76 per cent of global energy use and similar amount of CO2 emissions. Infrastructure and urban form are interlinked and shape the land use, transport choice, housing and affect the sustainability and efficiency of the city. This needs adopting a low carbon (thus low emissions) urban form and structure.
The critical actions for clean air comprise the following:
● Air monitoring data and analysis
● Density/ FAR optimisation and mixed land use
● Connectivity, walkability, and transport
● Zero polluting power and industries
● Phasing out Bio-Mass fuels
● Dust control
● Landscape as sink of air pollution
These strategies need real time data and inventory as the basis.
Air Monitoring Data and Analysis
There is little information about the real-time pollution levels in the immediate vicinity that are affecting the people’s health. Delhi has only 26 air pollution monitoring stations which provide local data on pollution levels. The information on air pollution is often ad-hoc and inadequate. Lack of Continuous Emissions Monitoring (CEM) equipment means that stakeholders are unable to identify the sources, diagnose and enforce that are worsening the problem.
Air quality data is significant to gaining a thorough understanding of local air pollution. Recent technological advancements have made it possible to gather data, with new low-cost monitoring devices and advanced methods of collating and analysing it. This helps to gain a robust understanding of pollution levels, their causes and effect.
Now-a-days smart electricity poles with sensors are available to monitor pollution parameters along with light, CCTV, WiFi, etc. The New Delhi Muicipal Corporation (NDMC) has been using them in the capital. Citywide air quality monitoring networks and data from these can provide consumers with a continuous feed of air quality in their area.
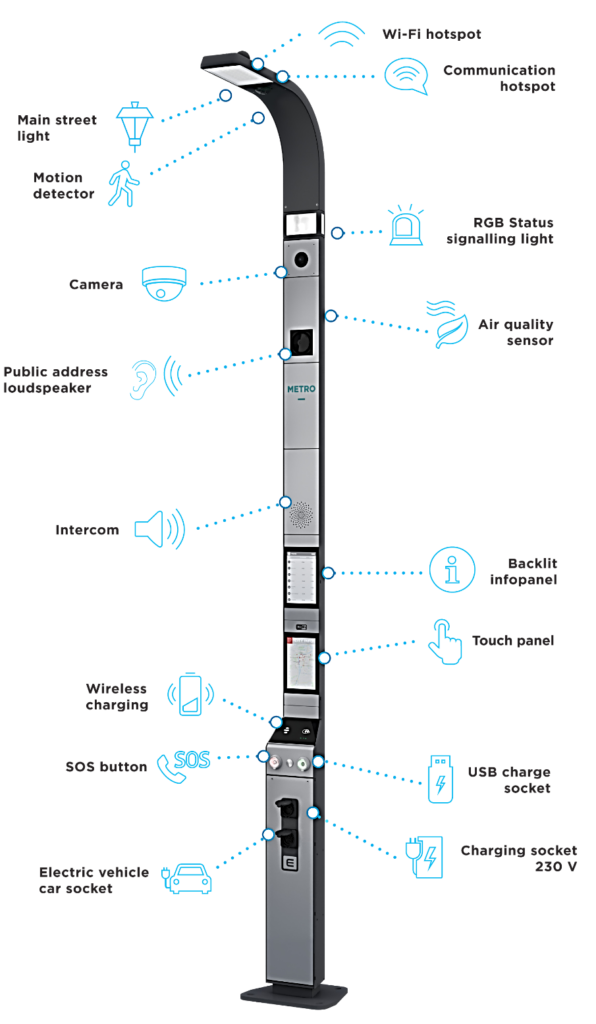
Fig. 2: Intelligent Smart Pole
The Google plans to map street by street air pollution that will be available to the common man. The active sensors will measure CO2, CO, NOx, NO2, ozone and particulate matter.
CEMS and Air quality data can be used to identify major components, sources, quantification and projects. It can also help the government to apply monetary incentives and penalties for polluting companies. SPCBs can provide tax benefits and ease other regulations on emission-efficient industries while penalizing inefficient ones. At the central level, the CPCB can also use this data to introduce a cap-and-trade system, instead of the existing ‘command-and-control’ regulations. The data can be used to analyse the issues, sources and project various options and actively schedule to assign the responsibilities, project management, including timelines and monitoring.
Accordingly comprehensive strategies can be developed for air pollution control, which cover the aspects of Technology, Public Engagement and Policy Imperatives. The following matrix chart gives an overview of such strategies.
Table 4: Technology, Citizen Engagement and Policy Matrix for Clean Air
| Manufacturing and Industry | Energy | Urban Mobility | Environmental Data | Building and Construction | Farming | |
| Technology | ● Installing continuous emissions monitoring technology (CEMS) at manufacturing locations, placing more accountability on industrial polluters
● -Development of low-emission commercial and industrial vehicles processes and logistics ● Optimise industrial infrastructure and promote industrial restructuring ● Accelerate technological innovations |
● Emission and fossil free technology
● Trigeneration ● Renewable Energy ● Zero Net Energy Building ● Use of Gaseous Fuels ● Elimination of D.G. Sets ● Smart Meters ● Micro Grids |
● Development of low-emission public transport
● Increase the use of electric cars/e-rickshaws ● NMTs, pedestrians ● Transport Demand Management ● Transit Oriented Development |
● Installing citywide air quality monitoring networks.
● Communicating air quality data through mobile Apps |
● Green building technologies that produce as much energy as a building consumes.
● Cool roof ● Net Zero Energy Building ● Passive design, Natural ventilation, ● Indoor plants ● Green Rating
|
● Use of agriculture residue for power generation
● Conversion of agri-waste material, bio-char ● Satellite surveillance ● Gasification technology to convert bio-waste into pellets/ electricity |
| Citizen Engagement | ● Applying public pressure on polluting industries
● Promote citizen engagement in industrial environment management ● Disclosure of air pollution data |
● Renewal energy
● Campaigns ● Facilitates reduced energy consumption
|
● Providing N-99 pollution masks to traffic policemen, municipal workers, street vendors, etc.
● Initiating a public campaign for carpooling and ridesharing |
● Vayu Apps
● EIA ● Early warning system |
● Green building movement
● Incentives for GRIHA rating ● Promote citizen participation |
● Incentives and infrastructure for recycling agriculture residue |
| Policy | ● A cap-and-trade emissions scheme for industries
● Ensuring compliance of industrial emissions with the standards ● Enforcement ● Institutional and legal review ● Strengthened environment threshold and industrial layout ● Clarify responsibilities of government, enterprises and civil society |
● Emission Tracking Systems
● Install clean energy production and supply |
● Building support for tighter controls on vehicular emissions
● Increased use of electric vehicles . |
● Actionable use of environmental data.
● Publicizing and campaigning for action or Pollution Graded Response Plan. |
● Facilitating the widespread use of a green rating for a building’s energy consumption and produced emissions | ● Schemes for proper management of agricultural waste and waste to energy schemes |
Density/FAR Optimisation and Mixed-use: Compact, high-density, mixed use development near public transportation infrastructure provides housing, employment, entertainment and civic functions within walking distance of the transit system. It aims induce public transport use– through policy measures so that the maximum number of people through densification and enhanced connectivity.
Reducing the need to travel involves maximizing densities and minimising urban footprints. Higher the density, lower are the per kilometre infrastructure cost and carbon emission. A balanced mix of jobs and housing along public transit corridors also contribute in reducing air pollution. A synergy between land use and public transport system is necessary to restructure the city by Transit Oriented Development and mixed land use for a compact and smart growth.
Connectivity, Walkability and Transport: Prime Minister Narendra Modi while inaugurating the Global Mobility Summit in September 2018, encapsulated 7 Cs of mobility- common, connected, convenient, congestion-free, charged, clean, and cutting-edge. He underlined the need to use clean energy for transport as a powerful weapon against climate change. This means a pollution-free clean drive leading to clean air and better living standards. He championed the idea of clean kilometres which could be achieved through bio-fuel, electric or solar charging and electric vehicles.
The installation of engine optimisation and exhaust gas recirculation technologies and promoting rail and waterways for public transport and freight can reduce black carbon emissions by 90 per cent. Some other critical areas to reduce emission from transport include:
● Development and spread of low emission public transport, commercial and private vehicles
● To increase the use of electric cars, e-rickshaws and e-buses
● Initiating a consumer campaign for car-pooling and ride-sharing
● Building support for tighter controls on vehicular emissions and stricter compliance with PUC norms.
● Providing N-99 pollution masks to traffic policemen, rag pickers, street vendors, sanitary workers, construction workers, students, etc.
Zero Polluting Industries and Renewable Power
Industries and power have a crucial role in shaping India’s path to combating air pollution. Cement and steel are the building blocks of modern infrastructure and the two industries account for roughly 10 per cent of global greenhouse gas emissions. These industries need to shrink their environmental footprint by following measures:
● Strengthening of enforcement and emissions monitoring
● Scaling up of Emissions Trading Schemes.
● The development and installation of emissions free technologies, especially in the power and brick-making industries.
● Installing continuous emissions monitoring technology (CEMS) at manufacturing locations and placing more accountability on industrial polluters.
● Introduction of gaseous fuels and enforcement of stringent SO2/NOx/PM2.5 standards for industries using solid fuels.
● Elimination of DG set usage by provision of 24×7 electricity and by innovative tall pipe control technologies.
● Use of agricultural residue in power plants and ether industries to replace high ash coal and open burning in fields.
Innovations at local level are important. Chakr Innovations Pvt. Ltd. proposed a technology that coupled with exhaust pipe of diesel engines absorbs PM emissions and converts the captured particulate matter into black ink and paints. In this project, the goal was to test the effectiveness of Chakr’s device in reducing PM emissions, and assess if this technology is a cost-effective way of reducing diesel genset pollution.
Another project, Charvesting, deploys charvesters that recycle rice straws into biochar with clean emissions using the biochar reactors. It helps farmers to comply with existing air pollution laws at minimal cost and effort, increase soil productivity and restore depleted land.
Phasing Out Bio-Mass Fuels
Air pollution is caused by burning of fossil fuels, especially for cooking, wastes, etc. This can be mitigated by following measures:
● Boosting of PNG Supply Network and clean-cooking stoves that use PNG/ LPG or solar energy.
● The implementation of gasification technologies to help convert waste into biomass pellets or electricity.
Dust Control
Dust is a major contributor to urban air pollution. It is necessary to adopt wall to wall paving of roads, green cover, trees and shrubs and the vacuum sweeping of roads. Dust particles can be controlled by screens, filters, flagging machines, vacuum cleaning, humidification, sprinkling of water and artificial rain.
Landscape as Sink of Air Pollution
The plants remove toxic pollutants from environment by the process of phytovolatilization (pollutant is released in volatile or gaseous form), phytoextraction (pollutant is accumulated in harvestable parts tissue like leaf surface), phytodegradation (pollutant is broken down into simpler molecular form), phyto stimulation (organic pollutants from soil are broken down ensuring oxygen to the rooms) and phyto-stabilization (pollutant is immobilized in soil). The indoor environments also reflect outdoor air quality and pollution. As such, it is necessary to sustain existing trees and increase number of healthy trees, which will reduce and regulate pollution levels. It is also necessary to plant evergreen trees which can filter air pollutants. Plants with smaller, rough and variegated leaves are more efficient in trapping air pollutants than longer and smooth leaves.
Conclusions
The strategic pathways towards clean air start with digital, real-time documentation of various sources of air pollution. These should be basis of the preparation of pollution control plans at district, municipal, and local levels. Low carbon urban systems requires alternatives such as net zero energy buildings, blockchain technology, and smart utilities. All these involve Big Data Analytics, Supervising Control Data Acquisition Systems (SCADA), ERP solutions, GIS Integrated Digital Control/ Command Centres and Satellite Surveillance.
Brief About the Author:
A. K. Jain worked as Commissioner (Planning), Delhi Development Authority and as a member of the Committee of the Ministry of Housing and Urban Affairs on the DDA (2015). He was a member of UN Habitat (2007-12). Author of several books, he is visiting faculty in planning and architecture. He was awarded 2nd Urban Professional Award 2014 at World Urban Forum in Medellin, Colombia and IBC Lifetime Achievement Award (2016).