Cities are increasingly recognised, graded, and ranked based on the scale of services their administration provides to end users. With various digital tools backed by the computing power offered by technology, using spatial and attribute data to extend services based on logical analytics has become possible. While this technical know-how is available, there is a skill divide among administrative teams, IT solution providers, and planners. This leads to a situation where what planners visualise needs to be fully translated into operational initiatives, and the end-users expectations from services are left unaddressed. Cities will become smart when services are delivered per end-user expectations and viable for the provider. The maturity of such services, in turn, defines the city rankings in real terms.

This paper outlines the potential linkages among spatial and attribute data sets and presents an approach for using GIS to formulate avenues for providing information and services to end users. The content also provides a potential approach for using this information to achieve real-time comparisons among city areas based on user-defined criteria.

Introduction
Automation in service delivery has opened several avenues for planners to conduct fact-based and location-specific analyses to arrive at service solutions. Such analysis helps create area-based plans and makes forecasts more meaningful since they are based on trends of past events. With the availability of mechanisms to document development parameters as they happen, the metadata for these events becomes an effective tool for providing specific information sets for users, administrators, and decision-makers to dovetail the plans and strategies for implementation. GIS tools and application interfaces have the potential to provide information indicators on the maturity of services using defined analytics to arrive at the ranking parameters for city areas.
Current Situation
As part of digital service provision initiatives, several programs are underway worldwide. Some yearly yardstick reports rank cities based on specific parameters like cleanliness, health facilities, etc. These ranks are mainly based on the extent of joint program implementation, citizen perception, percentage of spend, etc. While consultants and administrators drive this, the end user or citizen often needs help understanding the actual value of implementation to them. At the end of the process, this customer of service is usually satisfied with the quality of service.

Assessing The Need For Solutions
The purpose of the City Index/Ranking is to provide a reference parameter for end users to make informed decisions based on parameters of their choice. Spatial solutions need to provide a way for users to select parameters of their choice. At the same time, overall city indexes must also be based on spatial data and information from selected databases. Commonly used applications like Google Maps/MapMyIndia and a few others available in digital format need to be used to form a combined format on which a dynamic ranking of areas can be built and scaled up to the city level. Considering the above, there is a need for a channel to supplement the provider information to the end user for meaningful interpretation. The following vital parameters form the basis for this channel:

- End users or customers of service, i.e., citizens, get a chance to contribute with their piece of information attributes. Currently, there are channels where users can input spatial data and attribute information. Such data from spatial information mapped or updated by citizens must be used through logical processing.
- The city-level information from the administration on infrastructure and services needs to be integrated.
- Appropriate analytics are required to aggregate the figures.
- A standard output needs to be agreed upon to display results for consumption by all stakeholders.
The service benchmarking or city ranking with real-time processing of information captured and processed as above shall depict more meaningful and near-to-reality results. The subsequent sections of this chapter intend to outline the path for the same.
Elements of City Information Systems
In today’s digital age, we rely heavily on digital tools for everyday activities. These tools not only provide a variety of options but also track changes on the ground. Many city functions have shifted to digital mode, and technological advancements have introduced interfaces among digital databases, both spatial and numerical. It is essential to leverage this synergy to logically group information and facilitate information exchange among providers for meaningful results. Such an approach will enable informed decision-making and enhance governance and planning. The service landscape of a city depends on the following broad categories of needs:
Category 1 – Networked Infrastructure services like road, water, power, transport, etc.
Category 2 – Social Infrastructure services like educational institutes, commercial areas, marketplaces, hospitals, care centres, places of worship, parks and recreation spaces.
Category 3 – Other services like office spaces, industrial areas, etc.
Category 4 – Citizen attributes along with land, ownership information, etc.

The figure 1 below shows the elements that form the basic structure of the City Information System.

Figure 1 – Basic Constituents of City Information System.
Listing Datasets
City rankings should be based on physical and socio-economic parameters. Various datasets from different departments within a city’s jurisdiction must be centrally converged and accessible. Some of these datasets include:
A. Digital Databases
- Economic Activity: GST registration details of business outlets by city are classified by pin code.
- Transaction Data: All entities are classified by state, city, and locality.
- ULB Budget Information: Includes funds (own/grants/loans) and expenditure details.
- Registration Details: For schools, shops, hospitals, etc., from ULB databases.
- Consumer Data: For water, power, and sewer connections from provider agencies.
- Master Plan Information: Spend details for footpaths and roads.
- Service Data: Information on services provided in manual and digital modes.
- Location Lists: Banks, ATMs, public toilets, parks, etc.
- Public Transport Data: Ticket sale data for buses and metro.
- Connectivity Data: Air and rail timetables for city connectivity.
- Solid Waste Collection Data
- Rainwater Harvesting and Solar Installation Data
B. Spatial Databases
- Satellite Imageries: From sources like Bhuvan (Bhukosh) and Landsat, available at nominal fees.
- Shape Files/Maps: From ULB for master plans and ward divisions, usable in open-source GIS software.
- Commercial Spatial Data: Google Maps, Open Street Maps, and Map My India data are available for purchase.
Figure 2 categorizes key datasets by the information grouping needed for analysis to develop relevant user statistics.
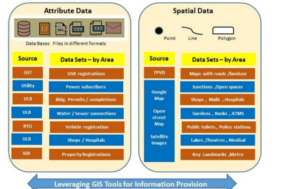
Figure 2 – Data Sets for City Information System
Avenues For Analysis Using GIS
Various GIS tools are available for spatial analysis, where information from multiple datasets can be pooled to build analytics. Such analytics are helpful for administrators and end users in their decision-making. Some of the avenues for such analysis are listed below:
- With the mapping of roads, the authority can gauge the extent of infrastructure reach to the last pocket of land.
- The trend of land sale data helps identify the direction of interest areas for end users and plan infrastructure on the ground to give the land parcels a developed status.
- Citizens’ decisions can be influenced when authorities’ plans for infrastructure expansions are seen on interactive maps, which show land parcels likely to be served by infrastructure.
In existing areas, built-up structures and additions/alterations can be tracked using satellite imagery. Information on building permissions/completions from municipal datasets makes queries customisable for logical interpretation of results.
Using datasets in sync with spatial data, information on areas with infrastructure availability, structures with clear titles, water/power/sewer connections, etc., can be highlighted with a click of a button, ensuring information security. Authorities can extend this service to citizens through a subscription-based digital service.
Guiding Principles For Building The Datasets
The datasets in service-providing departments within an urban local body are complex, and the interrelationships among these datasets are key for spatial analysis, required for making information available in a simplified format. To create meaningful analyses and provide users with parameters to choose from, the tools must be configurable for extracting information. The typical questions from users and administrators help IT professionals build database queries for the intended results. Some of these questions are:
For citizens
- Which areas should you choose to buy a house in?
- Explore options for schools/healthcare facilities for the family.
- Locations accessible by public transport and availability of amenities.
- The extent to which infrastructure facilities like roads, water, power, open spaces, shops, and banks are available.
- Identification of potential land pockets where infrastructure extensions are planned by authorities.
For authorities
- Indicators of economic activity within their jurisdiction to identify commercially active zones.
- Availability of amenities like parking in commercial areas.
- Concentration of properties let on rent in localities and building permissions in various areas.
- Vehicle concentration in areas concerning vehicle registrations.
- Popular areas for using metro/shopping/sales of different commodities.
To provide answers to such questions, IT tools have untapped potential that cities are waiting to explore. The website of the Singapore Redevelopment Authority is an example of a place where interactive maps allow users to explore various information sets within Singapore, making information readily available. Presenting information based on analytics can help develop rankings of areas based on multiple parameters.
These parameters are configurable according to an agreed set of baseline rules, such as:
- Availability of the service, and if available, at what distance from the user’s preferred location.
- The weightage assigned to the importance of the service as user preferences vary.
- Instances of accessibility to infrastructure like roads, metro, bus routes, along with social infrastructure like parks, schools, shops, hospitals, etc. Rating assigned based on distance criteria.
- Results displayed on parameters computed in sync with the ratings.
Figure 3 below outlines the approach graphically.
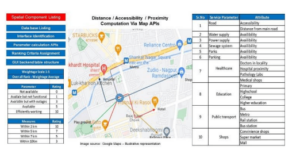
Figure 3 – Service Attributes and weightage criteria for building Queries
Visualisation Of Data Components – City Information Database (CIDB)
The information needed to validate service inputs is an important aspect of the process. The linkage is established through mapping parameters and the availability of these through IT-enabled service solutions, forming a repository called the City Information Database (CIDB). The different agencies instrumental in service provision gather information specific to individual offerings. Such information is being documented systematically through the process automation carried out under various IT initiatives over the last two decades. As such, it has strong potential to bring a catalytic effect to information exchange and enable service provision. It shall bring much-needed acceleration in the service provision mechanism, which is the primary intent of all IT initiatives.
In the context of urban services, conceptualizing CIDB components like infrastructure mapping, geo-referencing of assets, data inventory, and user information-based parameters of existing services becomes a prerequisite for meeting the objectives of CIDB. The CIDB repository aims to establish the linkage between spatial and service information datasets for user-specific queries.
The figure 4 below outlines the components of CIDB.
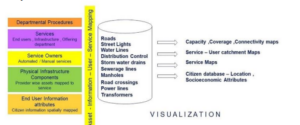
Figure 4 -Approach for Spatial and Service information for CIDB
Gis Solutions And Ranking System Evolution
GIS packages offer options for structuring the query results based on user input parameters and the planned decision-making criteria. The IT solutions teams are expected to perform the tasks below to help users get the intended information. These tasks are based on the datasets listed above and the intent of the computations.
- Use APIs from spatial tools to compute the counts/distances of various physical and social infrastructure parameters.
- Information of a statistical nature to compute the display parameters depicted in intended result displays (refer to presentation GUI Illustration).
- Algorithms to process data and populate tables as per the user in question.
- Display the results per the agreed criteria for counts and weightage score of each parameter.
The information classified according to user criteria is to be tabulated to suit the display designed for viewing by the end user. Figure 5 below illustrates the computation of the parameters.
Figure 5 – Outline for GIS-based Solution for City Parameter Computation
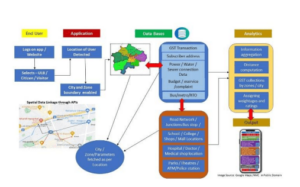
Figure 5- Outline for GIS based Solution for City Parameter Computation.
The Graphical User Interface (GUI) depicted in Figure 5 needs to be supported with spatial and numerical figures. As such, the first stage majorly comprises the following activities:
- Identification of key stakeholder departments.
- Listing of parameters and their mapping to stakeholder departments.
- Establishing the linkages among datasets.
- Spatial data identification for Application Interfaces.
- Base data sources for spatial information are Bhuvan, Google Maps, Open Street Maps, etc.
- Nodal agency finalisation.
- Consensus on computation aspects – Parameter rating criteria, weightings, analytics for weighted averages, and ranking criteria.
Features of the GIS-Based Ranking
The GIS-based rankings have key differentiators, as listed below. These will give citizens a unique experience, allowing them to compare city areas based on user-selected parameters.
- Users can view the development index of their areas of interest according to their chosen priority parameters.
- Authorities can view the rankings of their administrative areas based on the percentage of areas/wards with index values on a scale of 1-10, with the city classified as Class A/B/C, etc.
- The rankings automatically refresh with changes on the ground, reflecting improved or reduced index values.
- Rankings can be system-driven at fixed intervals, while users can see real-time updates based on ground changes or specific user locations.
- There will be no need to conduct yearly surveys, saving effort and expenditure for city governments.
- The rankings are real-time, readily available, and can be published at national, state, and local levels.
Conclusion and Implementation Path
The maturity of services is directly related to the ranking of cities. The end-user perspective also defines these rankings, as cities need to be perceived as “smart” from the users’ perspective. End-user satisfaction thus becomes a key element in recognising a city as a Smart City. There is a need to realign IT initiatives to provide a perceptual view of our cities.
Once scaled up, the approach to GIS-based city rankings should be visualised as a national-level initiative. However, information parameter standardisation across cities and states is necessary to scale up the solution. Initially, such an initiative should be trialled at a single city level, with parameter ranking based on the geographical division of the city, i.e., zones/wards.
References
- Bhukosh. n.d. Bhukosh. Accessed 2022. gsi.gov.in.
- MHOUA. City Finance Rankings_ Final Guidelines. 2022.
- Das, Aminya Kumar. 2007. Rawat Publishers.
- MHOUA. Ease of Living Index. 2019.
- Earth Explorer. n.d. “Earth Explorer.” Accessed 2022. usgs.gov.
- MHOUA. Municipal Performance Assessment Index Framework. 2019.
- Pattanaik, B.K. 2020. Introduction to Urban Development and Planning. Sage Publications.
- Gharpure, Praful. 2023. Service Delivery Process Framework – A Lifecycle Approach. Notion Press.
- Reichental, Jonathan. 2020. Smart City for Dummies. Wiley.
- Redevelopment Authority of Singapore. n.d. Accessed 2023. ura.gov.sg/maps.
- Urban World: Mapping the Economic Power of Cities. McKinsey Global Institute 2011.
Insight shared by: Dr Praful Gharpure, Sr. Consultant, Infrastructure Planning and Development, Tata Consultancy Services, Nagpur, India